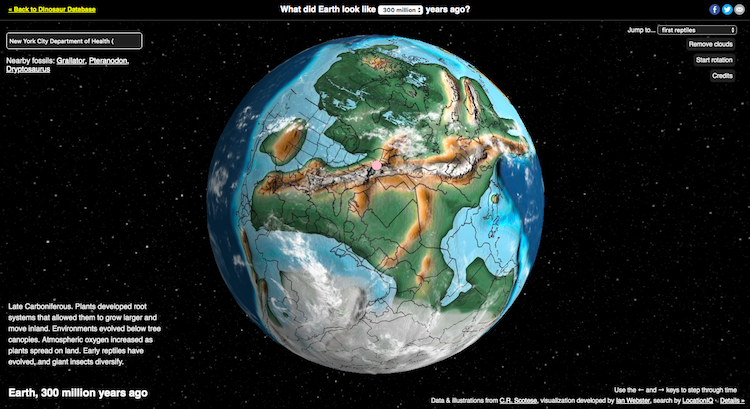
Ever wonder where your house was located 300 million years ago? Thanks to software engineer Ian Webster, now you can. His interactive map tracks how the globe has changed over the course of the last 750 million years as tectonic plates caused landmasses to shift. And in a clever twist, the website allows you to type in any address and see where it falls during any given time period.
Webster built the data visualization by using information collected by geologists to investigate tectonic plates. It’s incredible to see how Earth has changed over time, particularly during the breakup of supercontinent Pangea around 175 million years ago. While Webster points out that the locations on the open source project are approximate, it’s addictive to flip through the different time periods and see how the planet evolved. As landmasses emerge from the water and then split apart slowly over time, the Earth is shaped into the world we now know.
And, if you’re curious to know what was happening on Earth during any given time period, he’s also included a brief text on each map. Aside from looking up addresses, you can also skip to important moments in history, such as when the first dinosaurs or first primates appeared.
So what are you waiting for? Visit Webster’s project and start exploring.
h/t: [Open Culture]
Related Articles:
Map Reveals Where Modern Countries Would Be Located If Pangea Still Existed
Interactive Map Shows Where on Earth You’d Be If You Dug Straight Through the Ground
Eye-Opening “True Size Map” Shows the Real Size of Countries on a Global Scale
